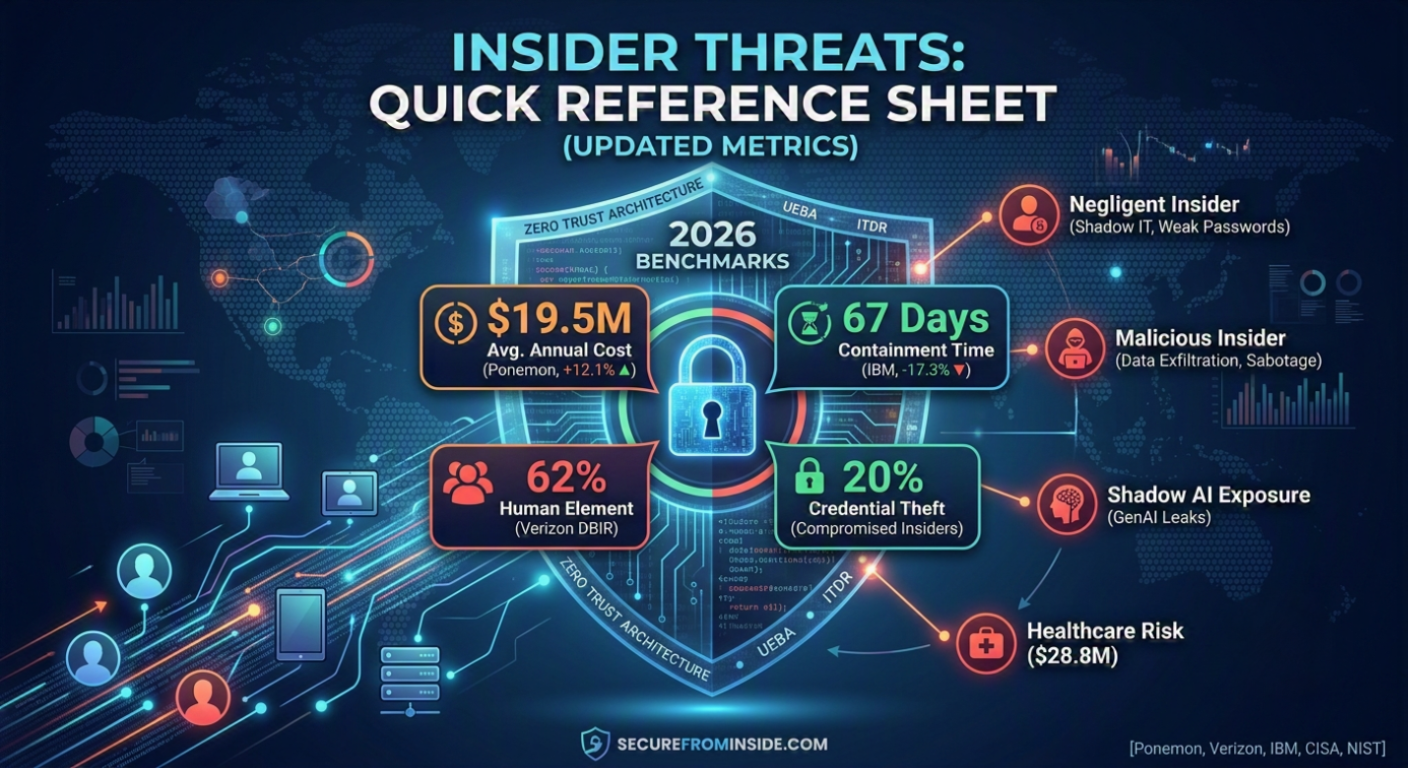
Key Financial & Operational Benchmarks
- Avg. Annual Cost per Organization: $19.5 Million | ▲ +$2.1M (+12.1%) [1]
- Avg. Time to Contain: 67 Days | ▼ -14 Days (-17.3%) [4]
- Containment Penalty: Incidents taking >90 days cost $21.9M vs. $14.2M for <30 days—a $7.7M penalty for slow response [1], [4].
- Organizations Impacted: 83% (Unchanged) [1]
1. Big Picture Benchmarks & Deltas
| Metric | Previous Baseline | Updated Benchmark | Year-over-Year Delta | Primary Driver / Source |
| Orgs Experiencing Incidents | 83% | 83% | 0% (Unchanged) | Hybrid/cloud environment exposure [1] |
| Human Element In Breaches | 56% | 62% | +6.0% | Social engineering & phishing expansion [2] |
| Direct Breaches Caused by Insiders | 30% – 40% | 30% – 40% | 0% (Stable) | Proportion of confirmed internal breaches [3] |
| Avg. Annual Cost per Org | $17.4M | $19.5M | +$2.1M (+12.1%) | Forensic spend & compliance penalties [1] |
| Avg. Containment Time | 81 Days | 67 Days | -14 Days (-17.3%) | Behavioral AI & automated detection [4] |
2. Human Factor vs. Direct Insider Threats
- Human Element (62% of Breaches): Encompasses any breach involving human error, pretexting, or phishing [2], [5].
- Direct Insider Threat (30%–40% of Breaches): Root cause is an internal user via negligence, compromised logins, or malice [3].
- Distinction: All insider threats involve human behavior, but not all human-driven breaches originate internally.
3. Direct Threat Types & Incident Costs
| Threat Category | Previous Share | Updated Share | Share Delta | Avg. Cost / Incident | Key Characteristics |
| Negligent Insiders | 60% | 53% – 55% | -5% to -7% | $747,107 | Cloud misconfigurations & accidental leaks [1], [5] |
| Compromised Insiders (Credentials) | 10% | 20% | +10% (2x Share) | $842,462 (Highest) | Infostealer malware & session hijacking [1], [2] |
| Malicious Insiders | 30% | 25% – 27% | -3% to -5% | $742,125 | Data theft upon offboarding & sabotage [1], [3] |
4. High-Risk Vectors & Sector Breakdown
- Shadow AI Vector: 15% of employees use non-approved GenAI tools (72% via personal email logins) [1], [6]. Unmonitored Shadow AI leaks add an avg. $670,000 cost penalty per breach [4].
- Industry Disparities (Avg. Annual Cost):
- Core Controls: Zero Trust Architecture (NIST SP 800-207) [9], User Behavior Analytics (UEBA) [6], and Identity Threat Detection (ITDR) [2].
References & Data Sources
[1] Ponemon Institute & DTEX Systems: Cost of Insider Risks Global Report
https://www.dtexsystems.com/cost-of-insider-risks-report
[2] Verizon: Data Breach Investigations Report (DBIR)
https://www.verizon.com/business/resources/reports/dbir
[3] Carnegie Mellon University Software Engineering Institute (CMU CERT): CERT Insider Threat Research
https://www.sei.cmu.edu/research-capabilities/insider-threat
[4] IBM Security: Cost of a Data Breach Report
https://www.ibm.com/reports/data-breach
[5] CISA: Insider Threat Mitigation Resources & Guidance
https://www.cisa.gov/topics/physical-security/insider-threat-mitigation
[6] Gartner: Market Guide for Insider Risk Management Solutions
https://www.gartner.com/en/cybersecurity
[7] HIPAA Journal: Healthcare Data Breach Statistics
https://www.hipaajournal.com/healthcare-data-breach-statistics
[8] FS-ISAC: Financial Services Threat Horizon Report
https://www.fsisac.com/insights
[9] NIST: Zero Trust Architecture (Special Publication 800-207)